Problem Definition
An
important question in Finance is whether or not the stock market is efficient.
The market is efficient if knowledge of past information or changes in a
stock’s price tells us nothing about future changes in a stock’s price. In
order to test market efficiency, the historical data of IBM’s daily stock
return during 1994 is used. Then the data of the return on IBM during the last
five days is used to predict tomorrow’s return. To see if the last five days
can be used to predict today’s return, regression analysis is performed. If the
market is efficient, the data from the last five days cannot be used to predict
tomorrow’s return.
Data Collection
First, we
need to collect the data. The collection process is done in a simple way in
that it can be downloaded from any financial source website, such as Yahoo.
Second, the return can be simply calculated using the formula (Pt/Pt-1)
- 1. Click here to get the data file.
Model Formulation
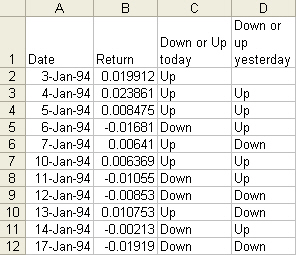
Let’s see
if daily price changes in IBM during 1994 are consistent with efficient
markets. We want to determine if knowing that IBM went up yesterday or down
yesterday would help us determine whether IBM will go up or down today. We
would like to know the fraction of the time IBM goes up today after going down
yesterday and the fraction of the time IBM goes up today after going up
yesterday. The following is the example of the input data:
The data is
analyzed using PivotTable. A
PivotTable report is an interactive worksheet table that quickly combines and
compares large amounts of data. Basically, it summarizes large amount of data
using calculation methods you choose. You can rotate its rows and columns to
see different summaries of the source data, and you can display the details for
areas of interest. After sorting out the table, it should look as follow:
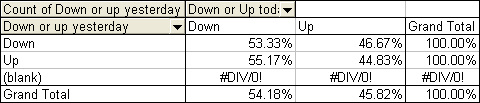
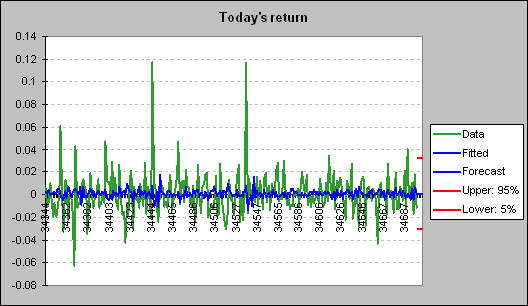
The figure above
makes it clear that how IBM did yesterday has little effect on how it does
tomorrow. If IBM went down yesterday it has a 53% chance of going down today,
while if IBM went up yesterday it has a 55% chance of going up today. Since 53%
and 55% are close, what happened yesterday appears to have little effect on
what will happen today. This is consistent with the efficient market hypothesis of finance.
Time-series forecasting
Time-series forecasting is a collection of methods used to predict future
outcomes based upon historical values. Time series analysis is an integral part
of financial analysis that is interesting and useful, with applications to the
prediction of interest rates, foreign currency risk, stock market volatility,
and the like. In this project, we use regression to look for market efficiency.
Regression is used to estimate the
value of one variable when other variables are known.
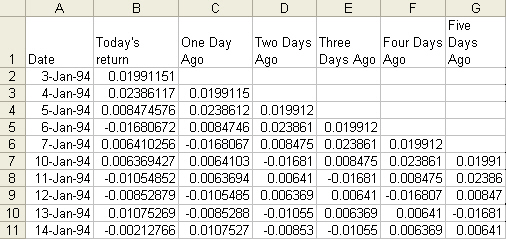
The next step is
to use regression to look for market inefficiencies. First, the independent
variables must be identified. The dependent variable is today’s return and the
independent variables are the last five days of IBM returns. The input data
should look as follow:
We are
now ready to use CB Predictor
to run the regression analysis. CB Predictor is just another time-series
forecasting tool for Excel. It is a fully integrated Excel function that uses
goodness of fit measures (RMSE, MAD or MAPE) and ranks the fits from best to
worst. First, it will individually forecast the independent variables (in this
case, the last five days returns) and then forecast the dependent variable
(today’s return) using multiple regression.

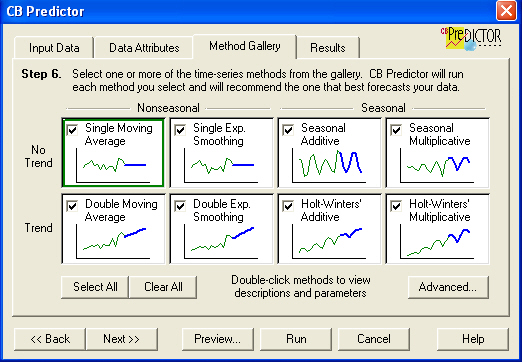
CB
Predictor lets us forecasts multiple series of historical data at once using
any of eight time-series forecasting methods shown below, including additional
seasonal methods. We can forecast all the series, trying all the methods for
each one. It will then tell us which method works best for each, according to
one of the three error measures (RMSE, MAD, and MAPE).
|
Summary: |
|
|
|
|
|
|
|
|
Number of series: 6 |
|
|
|
|
|
|
|
Periods to forecast: 4 |
|
|
|
|
|
|
|
Seasonality: none |
|
|
|
|
|
|
|
Error Measure: RMSE |
|
|
|
|
|
|
Series: Today's return |
|
|
|
|
||
|
|
|
|
|
|
|
|
|
|
Method: Multiple
Linear Regression |
|
|
|
||
|
|
|
|
|
|
|
|
|
|
Statistics: |
|
|
|
|
|
|
|
|
R-squared: 0.038 |
|
|
|
|
|
|
|
Adjusted R-squared: 0.01799 |
|
|
|
|
|
|
|
SSE: 0.08575 |
|
|
|
|
|
|
|
F Statistic: 1.9016 |
|
|
|
|
|
|
|
F Probability: 0.09474 |
|
|
|
|
|
|
|
Durbin-Watson: 2.001 |
|
|
|
|
|
|
|
No. of Values: 247 |
|
|
|
|
|
|
|
Independent variables: 5 included out of 5
selected |
||||
|
|
|
|
|
|
|
|
|
|
Series Statistics: |
|
|
|
|
|
|
|
|
Mean: 0.001142479 |
|
|
|
|
|
|
|
Std. Dev.: 0.019035226 |
|
|
|
|
|
|
|
Minimum: -0.06278027 |
|
|
|
|
|
|
|
Maximum: 0.1172249 |
|
|
|
|
|
|
|
Ljung-Box: 138.1209 |
|
|
|
|
|
|
|
|
|
|
|
|
|
|
Forecast: |
|
|
|
|
|
|
|
|
|
|
|
|
|
|
|
|
Date |
Lower:
5% |
|
Forecast |
Upper:
95% |
|
|
|
|
-0.029841488 |
|
0.001314582 |
0.032470651 |
|
|
|
|
-0.02996433 |
|
0.001318907 |
0.032602144 |
|
|
|
|
-0.030088215 |
|
0.001323232 |
0.03273468 |
|
|
|
|
-0.030213154 |
|
0.001327558 |
0.03286827 |
|
Regression Variables: |
|
|
|
|
||
|
|
|
|
|
|
|
|
|
|
Variable |
|
|
Coefficient |
t
Statistic |
Probability |
|
|
Constant |
|
|
0.001281 |
1.053 |
0.2934 |
|
|
One Day Ago |
|
|
-0.09217 |
-1.4401 |
0.1511 |
|
|
Two Days Ago |
|
|
-0.0767 |
-1.1976 |
0.2322 |
|
|
Three Days Ago |
|
|
0.005791 |
0.09007 |
0.9283 |
|
|
Four Days Ago |
|
|
-0.08692 |
-1.3604 |
0.175 |
|
|
Five Days Ago |
|
|
0.1193 |
1.8705 |
0.06262 |
Interpretation:
The R square value of 0.038 means that the
last five days of return explains only approximately 4% of the variation in today’s returns.
The
equation for forecasting today’s IBM return would be:
Today’s
return = .01281 –.09217(1 day ago) -.0767(2 days ago) + .005791(3 days ago)
-.08692(4 days ago) + .1193(5 days ago)
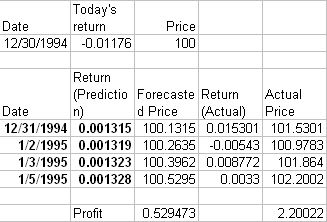
Predicted
results:
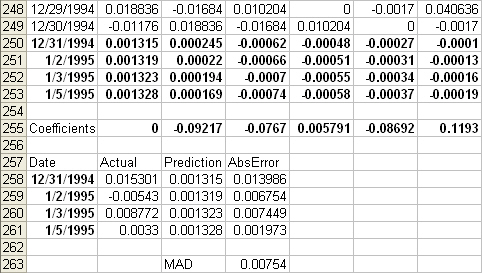
The
number of periods predicted = 4 (December 31, 1994 – January 5, 1995). The
model tells us that the predicted return for IBM stock on
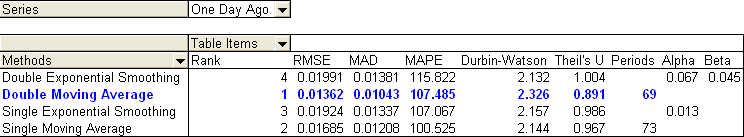
CB
Predictor is useful in that it also forecasts each of the independent
variables. The result of the forecasted first independent variable (one day
ago) or first series is shown below:
|
Series: One Day Ago |
|
|
|
|
||
|
|
|
|
|
|
|
|
|
|
Method: Double Moving Average |
|
|
|
||
|
|
Parameters: |
|
|
|
|
|
|
|
|
Periods:
69 |
|
|
|
|
|
|
Error: 0.01362 |
|
|
|
|
|
|
|
|
|
|
|
|
|
|
|
Series Statistics: |
|
|
|
|
|
|
|
|
Mean: 0.001216062 |
|
|
|
|
|
|
|
Std. Dev.: 0.019020251 |
|
|
|
|
|
|
|
Minimum: -0.06278027 |
|
|
|
|
|
|
|
Maximum: 0.1172249 |
|
|
|
|
|
|
|
Ljung-Box: 138.7442 |
|
|
|
|
|
|
|
|
|
|
|
|
|
|
Forecast: |
|
|
|
|
|
|
|
|
|
|
|
|
|
|
|
|
Date |
Lower:
5% |
|
Forecast |
Upper:
95% |
|
|
|
|
-0.022246491 |
|
0.000245203 |
0.022736897 |
|
|
|
|
-0.022363808 |
|
0.000219689 |
0.022803185 |
|
|
|
|
-0.022481878 |
|
0.000194174 |
0.022870226 |
|
|
|
|
-0.02260071 |
|
0.00016866 |
0.022938029 |
Suppose
on
In conclusion, time-series analysis is vital in every aspect of business as it has its interesting and useful applications in such disparate fields as marketing, finance, and organizational behavior. It is important to be mindful that, despite the importance of the model, it is in fact only a representation of reality and not the reality itself. Accordingly, the model must adapt to reality; it is futile to attempt to adapt reality to the model.